Oct 20, 2020 | Excel, Training, Uncategorized
[vc_row][vc_column][vc_column_text]What do you do when the boss says “I have all this Excel data but I don’t know what it means”? Presenting your data in an organized way is critical to spot trends and to make projections. We all know that visualizing data is the key...
May 5, 2020 | Excel, Powerpoint, Training, Uncategorized
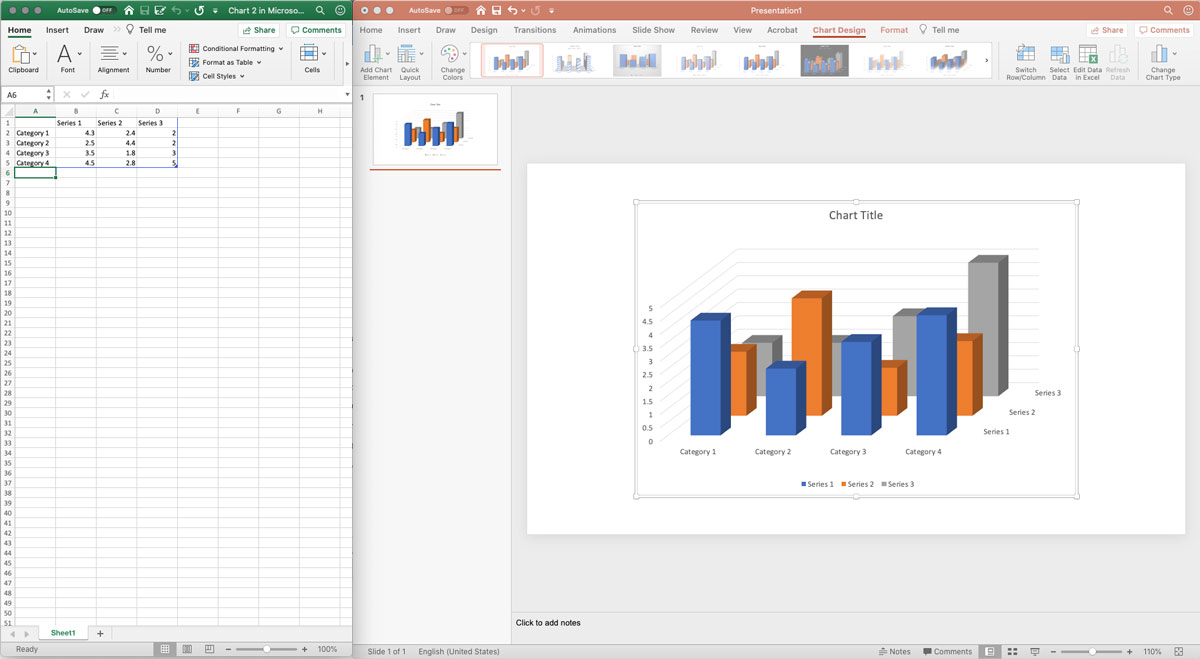
Everyone likes a good story. You have a story and you have data to back it up, but raw data can be hard to read. So, how can you make data interesting, easy to understand, and presentable? You can use data visualization which is the graphical representation of...

Aug 19, 2019 | Excel, Training, Uncategorized
Earlier this summer, we shared a story of a client who had to make sense of 80,000 rows of sales data. We taught him how to use Excel’s Pivot Table function to summarize and analyze the data. Now that he knows how to use PivotTables, he can create as many tables that...