Everyone likes a good story. You have a story and you have data to back it up, but raw data can be hard to read. So, how can you make data interesting, easy to understand, and presentable? You can use data visualization which is the graphical representation of information and data. When you use elements such as charts, graphs, hierarchy trees, and sitemaps, you can present your data in a way that feels like a story that your intended audience can understand.
Creating graphical representations based on your data sounds like hard work, especially if you are not a data analyst or scientist. Luckily, Microsoft can do this for you with the help of PowerPoint and Excel. We are going to show you how to create data charts in PowerPoint by using Excel to input the data.
Step-by-Step Process to Create a PowerPoint Presentation with Dynamic Data
- Open PowerPoint and create a blank slide.
- Click the Insert tab and click the Chart icon to choose a chart.
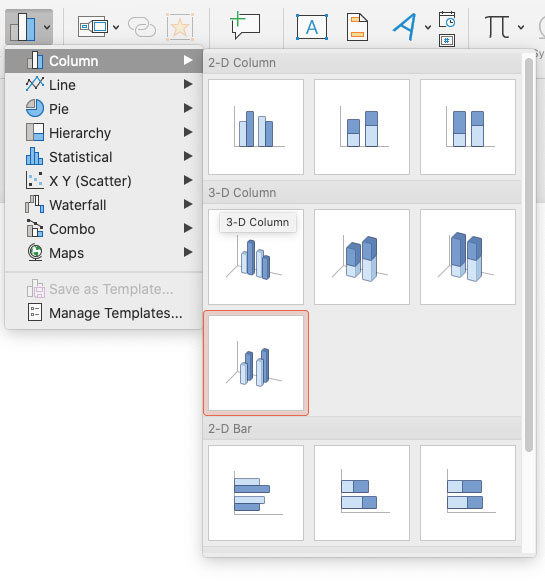
- In our example, we are going to choose Column > 3D Column.
- When you choose your chart, PowerPoint triggers Excel to open with example data. At this point, you can change the data and it will update your PowerPoint chart.
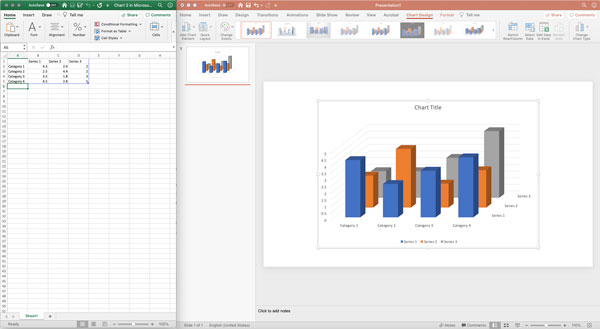
- After you have updated your data in Excel, you have other options to make your data more interesting:
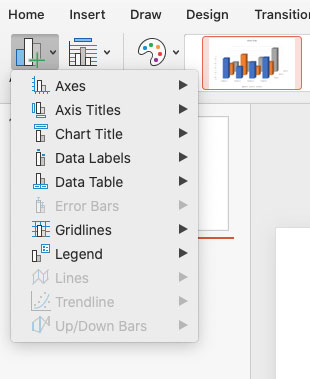
- You can click Add Chart Element to add additional data elements to your chart
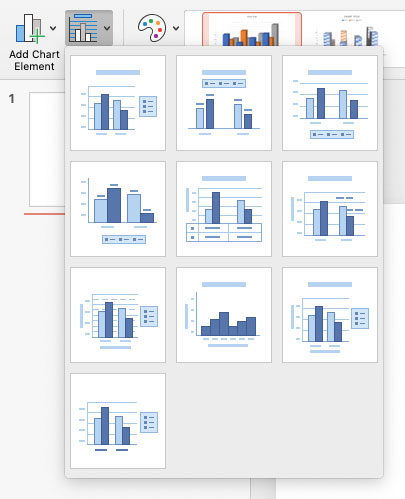
- You can click Quick Layout to choose pre-formatted layouts
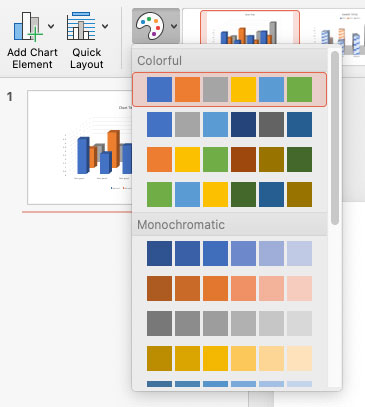
- You can choose a different color scheme in Change Colors.
- You can click Add Chart Element to add additional data elements to your chart
Now that you have created your first dynamic data chart with columns in PowerPoint, experiment with the other types of charts. The PowerPoint charts help you and others make sense of your data. Here are a few benefits of PowerPoint charts:
- Use data visualization to help sell products or services, show progress at a board meeting, or train your staff on how to be more efficient.
- Update your data without worrying about the visual formatting.
- Only show the most important data to your audience and avoid confusion or distraction.
- Bring consistency to your reports and presentations.
- No need to worry about learning a new platform like Tableau to visualize your data.
Data visualization is a great way to share and display your data in a way that grabs the attention of people. PowerPoint gives you the tool to make that happen. If you are interested in a group PowerPoint training course for your organization, contact us at jonr@cccsolutions.com or 301-332-0613. We would love to talk to you about it.