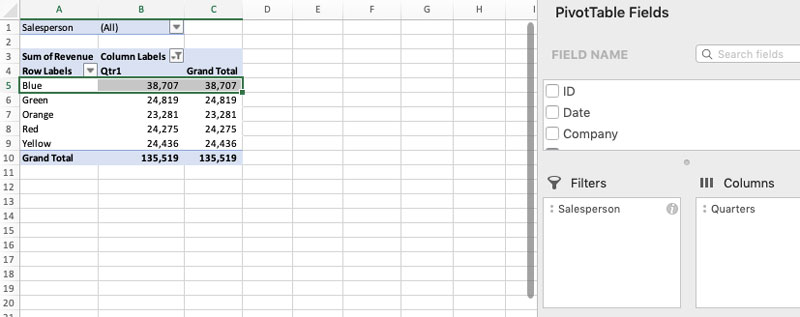
Earlier this summer, we shared a story of a client who had to make sense of 80,000 rows of sales data. We taught him how to use Excel’s Pivot Table function to summarize and analyze the data. Now that he knows how to use PivotTables, he can create as many tables that he needs to show trends and results. It is common to create multiple tables, but what if he needs to compare data between several pivot tables? He could apply filters to each pivot table, but that would take too much time. He is in a business where productivity and efficiency means profit, so he needs to analyze data quickly.
Excel has a function called “Slicer” to help analyze data between pivot tables quickly. The Slicer function does the comparison for you by filtering pivot table data. This tutorial will walk you through the Slicer function so you can filter your data quickly and efficiently.
Use the “Slicer” Function with Pivot Table.
- Click inside your pivot table.
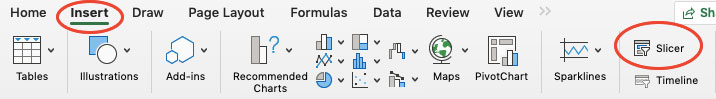
- Click on the Insert table and click the “Slicer” button.
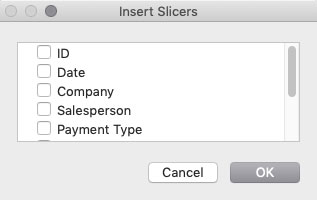
- Select the data that you want to filter and click OK.
- After the filtered table appears, move it where you want it on the spreadsheet.
- To link existing pivot tables to the slicer, right-click the slicer table and choose “ Report Connections” and click OK.
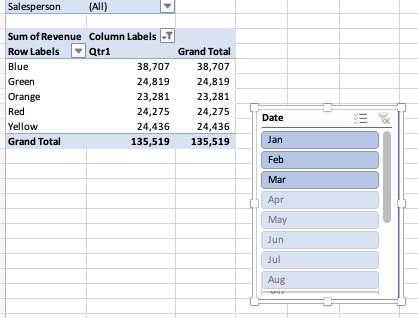
- Now you can select the data in the filter to only see data for that selection in your pivot tables.
Although it might take just a little time to configure your slicer, it will save you a lot of time in the long run, especially if you are analyzing data from several pivot tables. If you have questions about Excel’s Pivot Table function or would like to learn more about Excel training for your staff, please contact us.