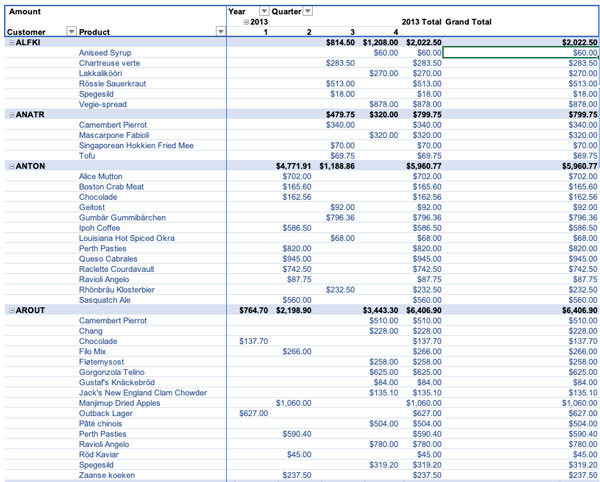
[vc_row][vc_column][vc_column_text]Excel’s foundation is built on the display and calculation of data correctly. This is why knowing how to use functions like Scenario Manager, Slices, and PivotTable is crucial when sorting and displaying data. In a previous blog, we shared how to create high-level reports with PivotTables. We would like to take that a little deeper and show you how to display the top records in a PivotTable. When you have hundreds and thousands of records, it is common to look at the top 10 or 25 records so you can better understand trends and activity.
If you need a refresher on creating PivotTables, click here.
How to display the top 10 (or whatever value you desire) in PivotTables:
- Open your Excel file with the PivotTable.
- Click the down arrow for your column. In this case, we will filter the Product column.
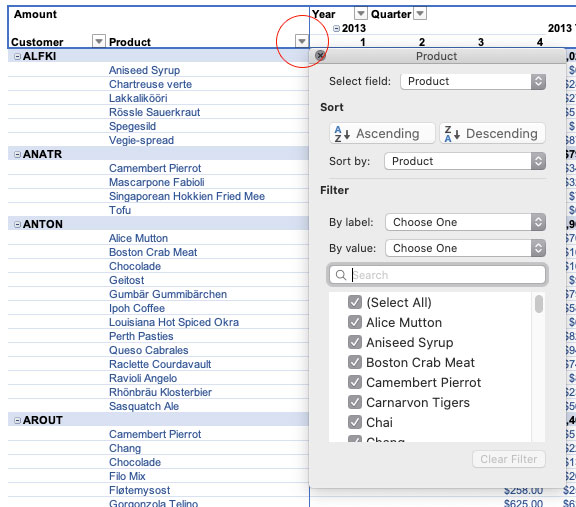
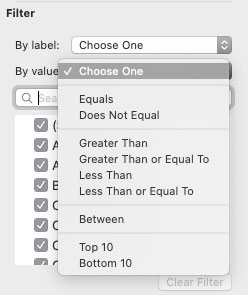
- In the Product dialog box, click the By Value dropdown under filter and choose Top 10.
- Enter your value, we will enter 10.
- Click OK.
Filtering is pretty simple, but you may want to clean it up just a bit. For instance, you may want to remove unnecessary information that can confuse. In this case, we are going to hide the Grand Total column for the filter.
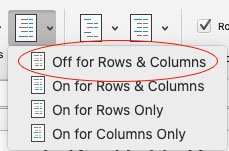
- Select your PivotTable and click the Design tab.
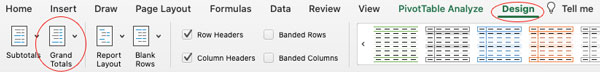
- Click the Grand Totals dropdown and select Off for Rows and Columns.
When filtering, it is also helpful to sort your data. The top 10 does not automatically sort your results, so you will need to do that. You can easily do this by selecting your PivotTable, right-clicking your top 10 and selecting either Sort > Sort smallest to largest or Sort > Sort largest to smallest.
There you have it. The top 10 in your PivotTable data. If you would like the Bottom values, follow the same steps except choose Bottom 10 instead of Top 10. PivotTables combined with Top 10 functionality is a great combination to help you make informed decisions.
CCC Solutions offers virtual corporate and group training on Excel and other Office 365 applications. You can find upcoming classes on our website. If you do not see a class offered that would be beneficial for your team, email us at jonr@cccsolutions.com and we will help get one scheduled for your organization.[/vc_column_text][/vc_column][/vc_row][vc_row][vc_column][vc_custom_heading text=”More Tutorial Topics” font_container=”tag:h2|text_align:center”][vc_empty_space][vc_basic_grid post_type=”post” max_items=”2″ element_width=”6″ orderby=”rand” grid_id=”vc_gid:1588009661839-415a7c15-a1b9-3″ taxonomies=”13″][/vc_column][/vc_row]